
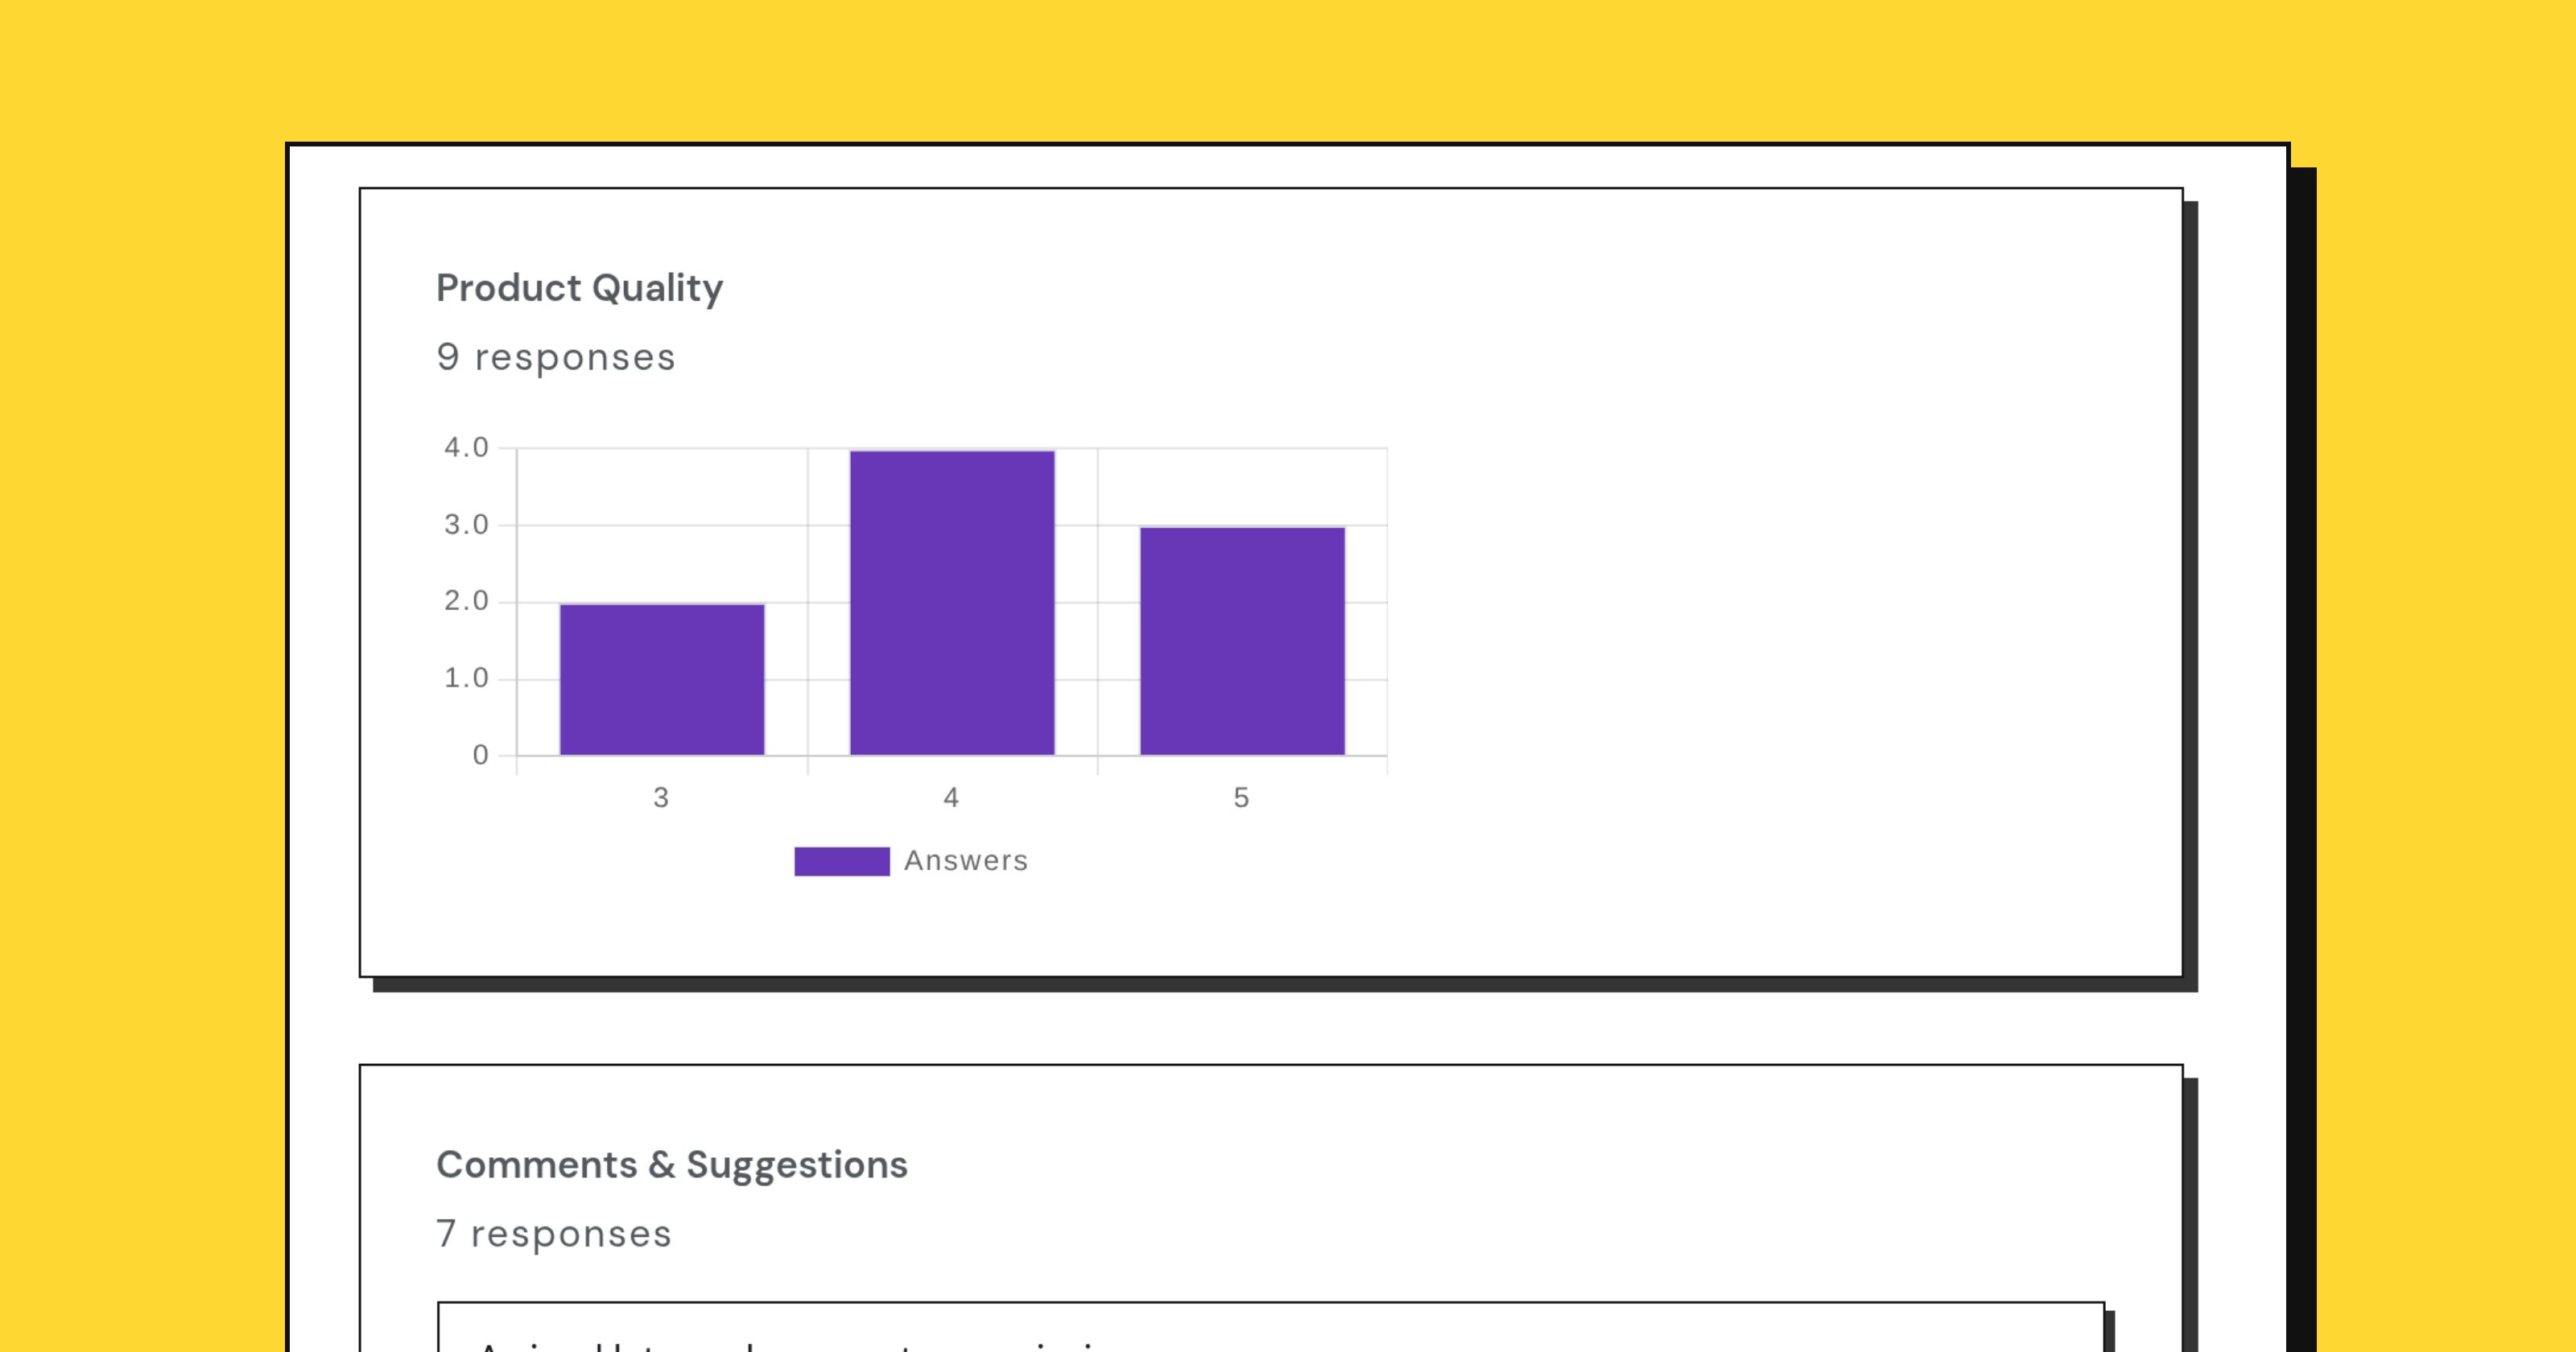
The moment a form takes its first response, a summary appears: counts, a chart per question, an average for every scale. It is genuinely useful and it is also the most reliable way to talk yourself into a conclusion you have not earned.
A summary is a description of the people who answered. Turning it into a statement about everybody takes more care than the chart implies.
Four questions before you quote a number
Who could have answered? A form link sent to your newsletter measures your newsletter. A link posted publicly measures whoever saw the post and had a reason to click. Neither measures your customers.
Who did? People with a strong opinion answer surveys. A satisfaction survey with a 5% response rate is largely a conversation between the delighted and the furious, with the indifferent majority silent.
How many? Twelve responses is an anecdote with a chart on it. The honest way to report a small sample is to say the count out loud every time: “7 of 12 mentioned the price”, not “58% said the price”.
Compared with what? A satisfaction score of 4.1 means nothing alone. It means something next to last quarter’s 4.4, provided you did not reword the question in between.
What the summary is genuinely good for
Noticing. A distribution with two humps, a question that half of people abandoned, an option nobody picked. These stand out at a glance and are worth chasing.
Cutting the read. Choice and scale questions summarize themselves, so your attention goes to the free text, which is where the reasons are.
Sharing without shipping the raw data. A public summary link lets other people see the aggregate without giving them a spreadsheet of individual answers. That distinction matters if the responses are at all sensitive.
Averages hide the shape
The average of a five-point scale where everyone answered 3 is 3. So is the average where half answered 1 and half answered 5. The first is a product nobody minds; the second is a product that some people love and others cannot use, and they need completely different responses from you.
Always look at the distribution before the mean. If the chart has two peaks, the interesting question is what separates the two groups, and that is usually answerable from another question on the same form.
Checkboxes do not add up to 100
A “select all that apply” question produces percentages that sum to whatever they sum to. If 70% picked speed and 60% picked price, that is fine, and writing “speed was the top answer at 70%” is fine, but a pie chart of it is a lie.
NPS is a single number by design
If you ask a 0 to 10 recommendation question, Questionful reports the score along with the promoter, passive and detractor split. Read the split. A score of 20 made of 40% promoters and 20% detractors is a different business from a score of 20 where almost everybody is a passive, and the number cannot tell them apart.
Free text is evidence, not a chart
Nobody should turn twenty paragraph answers into a pie chart. Read them, group them into five or six themes by hand, count the themes, and quote two or three verbatim. A quoted sentence from a real respondent moves a meeting further than any percentage, and it does not pretend to a precision the sample cannot support.
Write the caveat into the summary
When you pass the results on, put the sample size, the population and the dates in the first line, not a footnote. “142 responses from customers who bought in March, collected over two weeks” is the difference between a finding somebody can use and a chart somebody will misquote in a quarter’s time.
The summary is a good instrument. It just measures the people who answered, and that is not the same as the people you were asking about.