
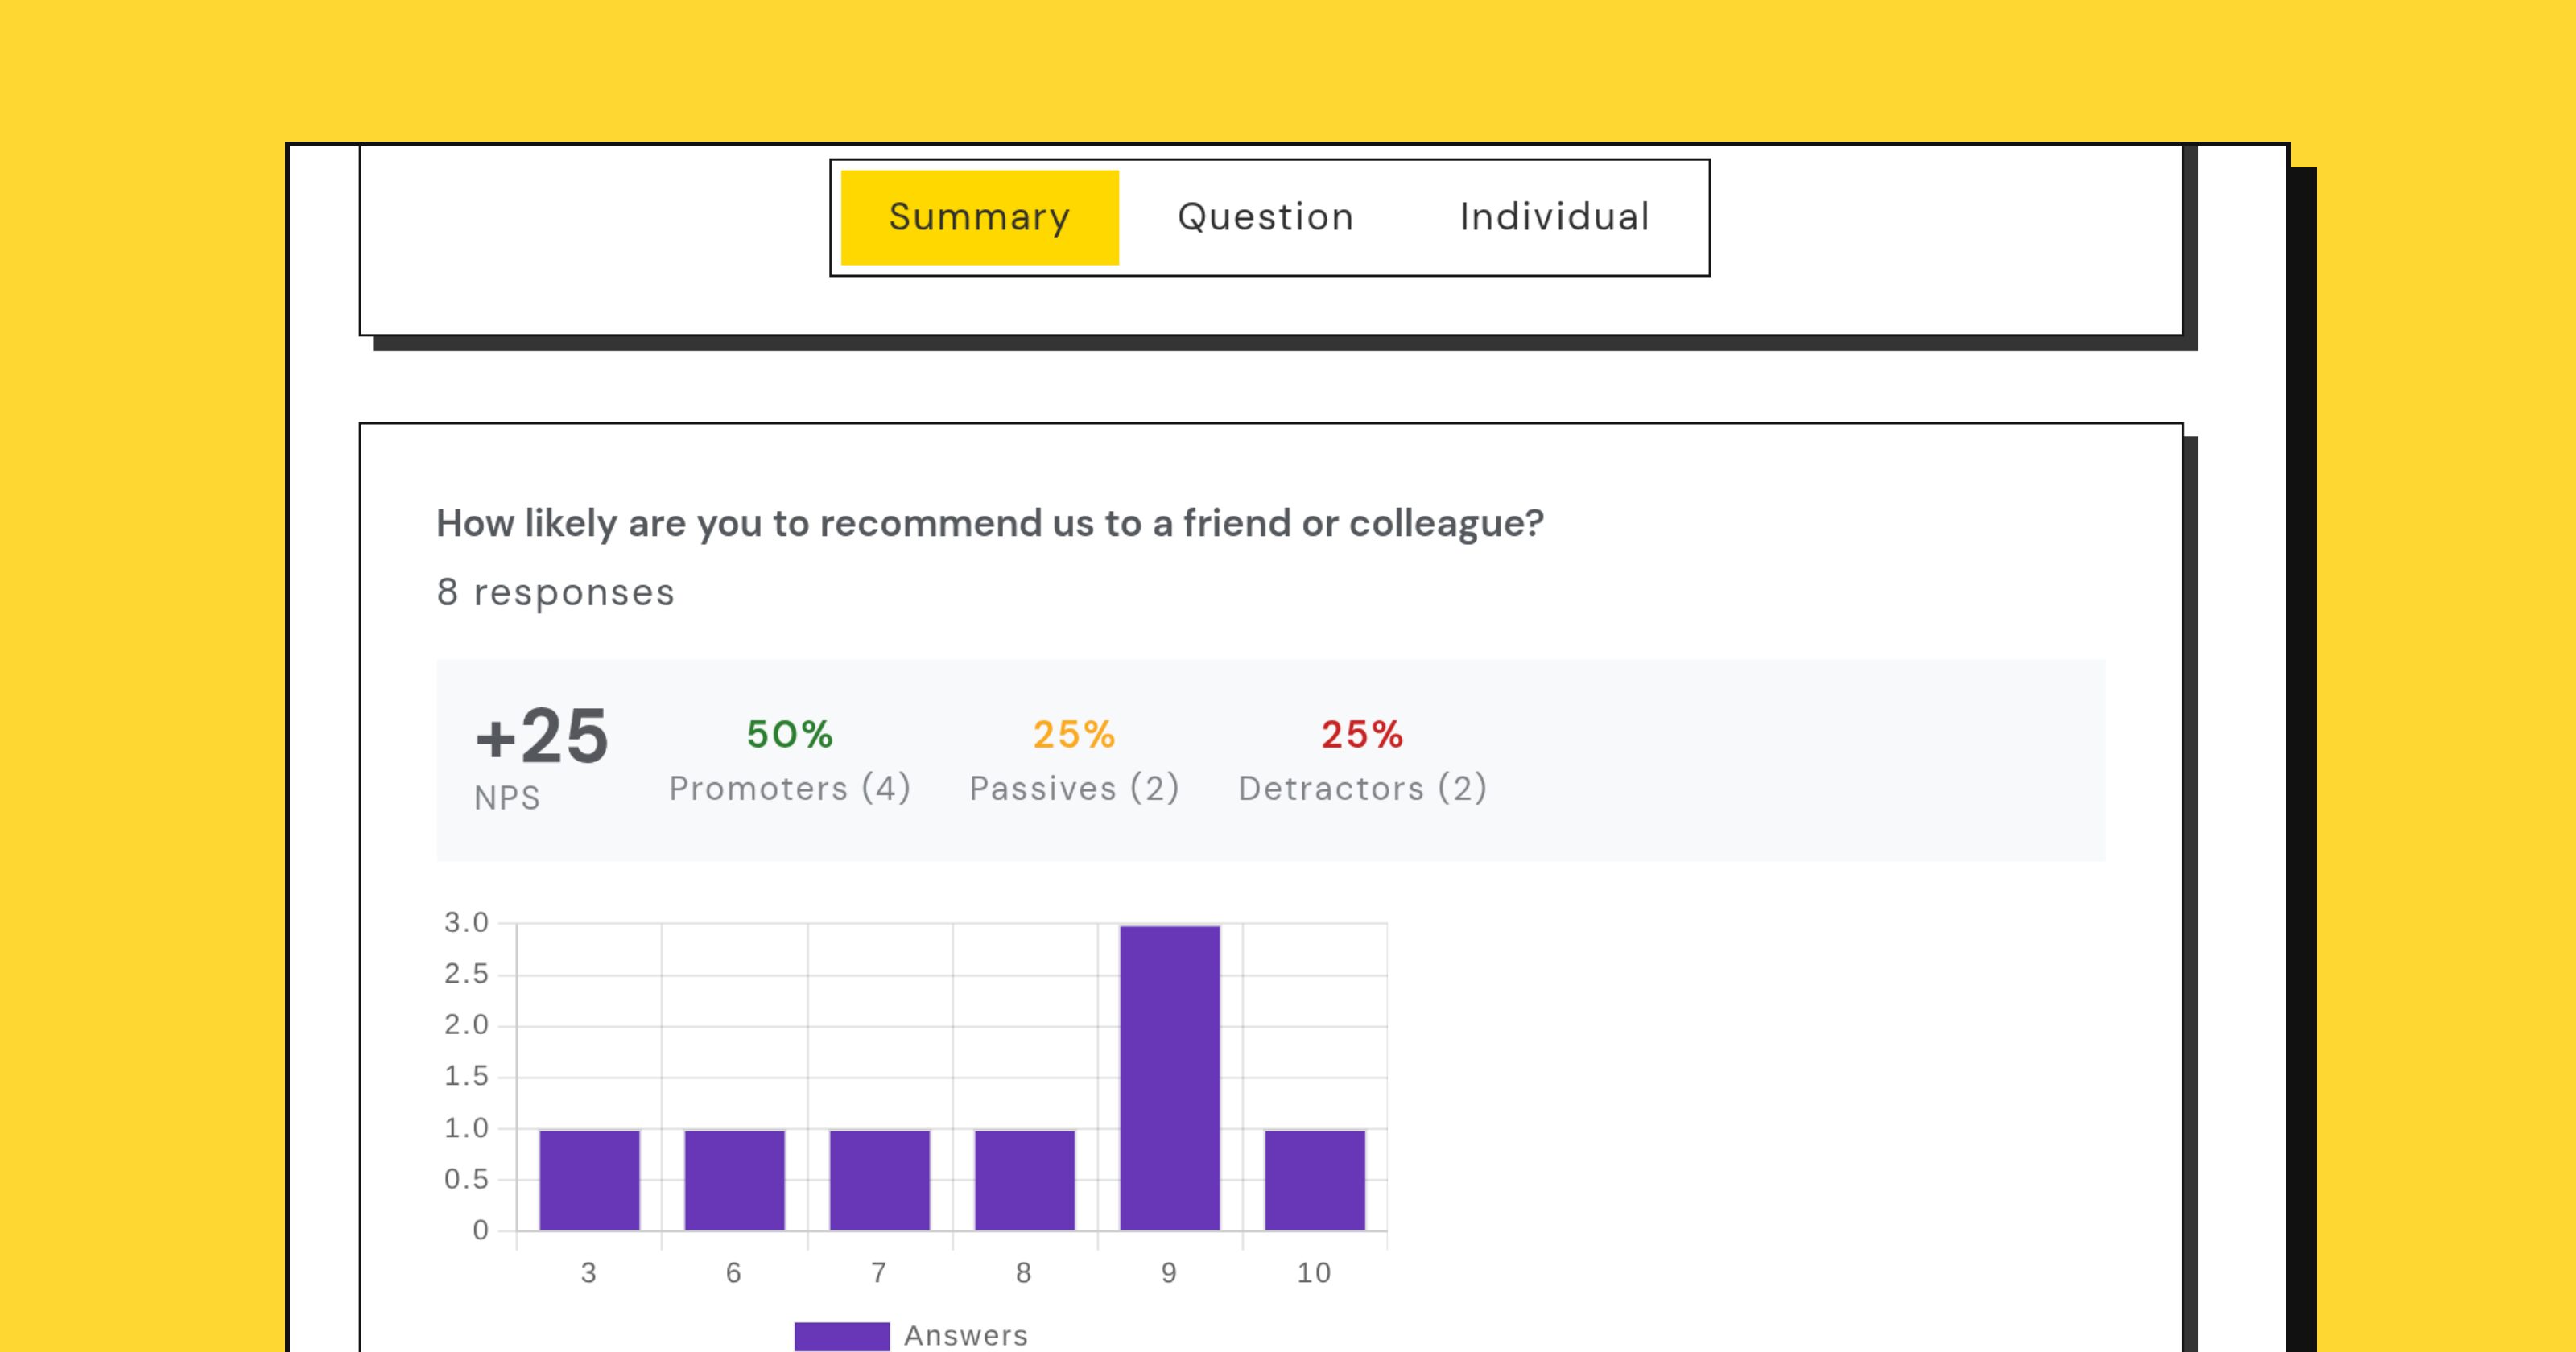
Net Promoter Score is one question and one number. “How likely are you to recommend us, 0 to 10?” Answers of 9 and 10 are promoters, 7 and 8 are passives, 0 to 6 are detractors, and the score is the promoter percentage minus the detractor percentage. It runs from minus 100 to plus 100 and it is not a percentage of anything.
Its popularity comes from being comparable across companies and simple enough to put on a slide. Both of those are also how it gets misused.
The split matters more than the score
A score of plus 20 can be 40% promoters and 20% detractors, with 40% passives. It can also be 60% promoters and 40% detractors, with almost nobody in the middle. The first is a business most people are mildly happy with. The second is a business that divides people, and the two need opposite responses from you.
Questionful reports the split alongside the score for any 0 to 10 recommendation question, in the responses tab and in the public summary. Read the three numbers, not the one.
Seven is not a pass
The scale is harsher than it looks. A 7 out of 10, which most people would read as a decent mark, counts for nothing at all: passives are excluded from the calculation. A 6, which feels like a mild grumble, counts fully against you.
This is deliberate, and it is why NPS moves more dramatically than satisfaction scores. It also means a small shift of people from 6 to 7 improves the score without anyone becoming happier.
Sample size, and the temptation to redecorate
With 50 responses, a handful of detractors swings the number by ten points. With that much noise, a quarterly NPS chart with one decimal place is decoration.
Report the count next to the score every time. If the sample is small, say so and treat a movement as a prompt to go and read the comments, not as a result.
It measures the people who answered
Everything true of surveys generally is true here. If you email the score request to customers who opened a support ticket, you have measured people who had a problem. If you show it in the product to whoever is logged in today, you have measured your most active users, who are by definition the least likely to churn.
Keep the audience and the timing identical between rounds, or accept that the trend is not a trend.
The follow-up is the whole value
The number tells you the temperature. The optional question after it tells you what to do, and it is the only part of NPS that produces work you can actually schedule. Keep it short and open: “what is the main reason for your score?”
One constraint worth knowing in Questionful: conditional logic runs on choice questions, not on scales, so you cannot branch on the 0 to 10 answer itself. If you want different follow-ups for promoters and detractors, ask a small choice question next to the scale and branch on that. Otherwise ask one neutral follow-up that works for everybody, which is usually the better survey anyway.
What it cannot tell you
NPS does not tell you whether people will actually recommend you, only what they said when asked. It does not tell you why the score moved. It does not survive being compared across industries, and it does not survive being made into somebody’s bonus, at which point you will find the question quietly reworded and the sample quietly improved.
How to use it well
Ask it rarely, of the same audience, in the same words. Read the split. Read the comments. Report the count. Treat a change as a question rather than an answer.
A single tracked number is useful right up to the moment it becomes the target. The NPS survey template is a reasonable starting point, and one honest follow-up question is worth more than the score it is attached to.